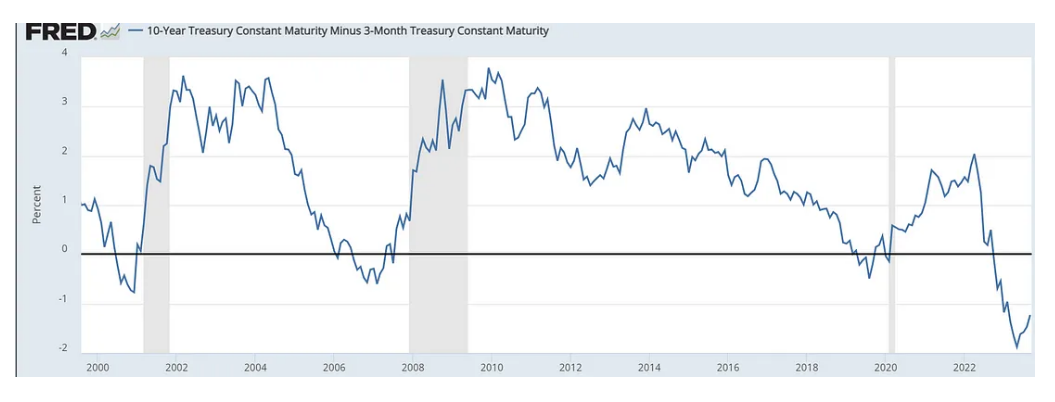
The spread between the 10-year Treasury and the three-month Treasury is a popular indicator for assessing the risk of an impending recession. As illustrated in the graph below, when the spread falls below zero, it has historically preceded recessions and significant market downturns, such as the bear markets in the dot-com bubble, the 2008 Great Recession, and the COVID-19 pandemic.
Now what I wanted to look more into was how does this affect returns and future volatility for small caps (IWM). Which should be magnified given that small caps are more susceptible to volatility.
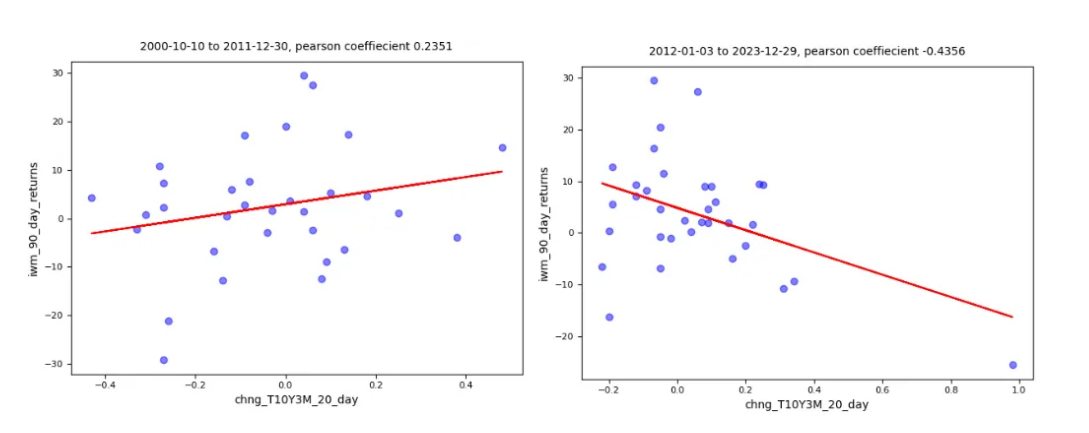
The left chart below shows the relationship between the yield spread (on the x-axis) and returns over the next 90 days for IWM (on the y-axis). As you can see, the relationship is positive but fairly weak, with an adjusted-R2 value of 0.06. However, the right chart shows that the 20-day change in the yield spread has a much higher impact on returns. The relationship between that change in yield spread and returns over the next 90 days has an adjusted-R2 value of -0.43.
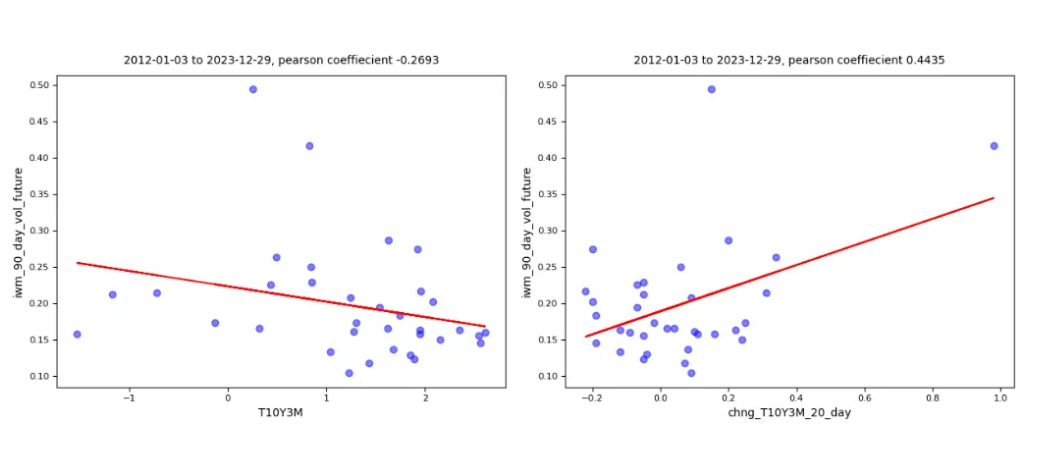
Future Volatility The left chart below shows the relationship between the yield spread and volatility over the next 90 days during the 2012–2023 period. The relationship is negative, with an adjusted-R2 value of -.27. However, the 20-day change in yield spread is nearly twice as correlated with future volatility, with an adjusted-R2 of .44.
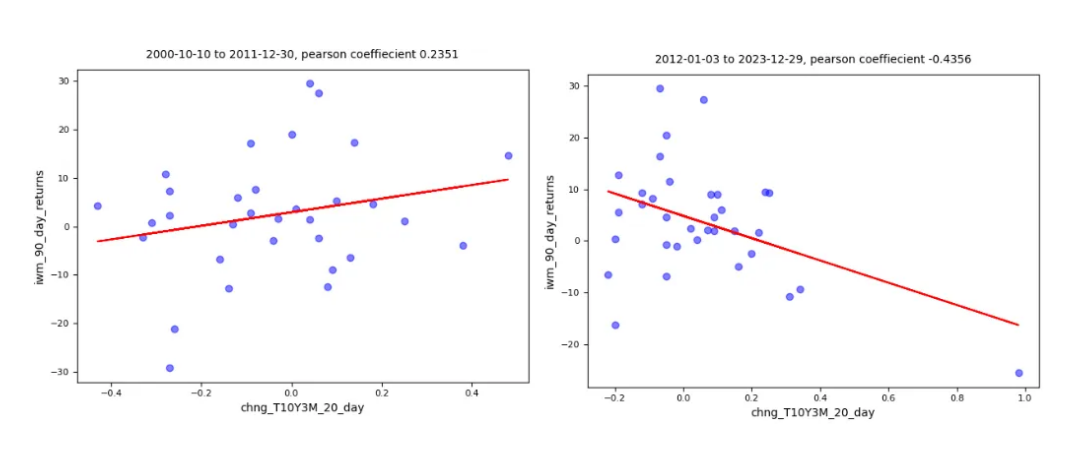
The left chart below revisits the relationship between the change in yield spread over the past 20 days and returns over the next 90 days, focusing on the 2000–2012 period. The right chart looks at the same relationship but from 2012–2023. The graphs shift from a positive to a negative relationship, indicating that it is unstable over time.
There is a significant negative association between the 20-day change in yield spread and future returns in small-cap stocks, but it is not stable through time. The yield spread itself did not have a strong relationship with future returns, but it did have a moderately positive association with volatility in the next 90 days.
This article should never be considered as investing guidance or advice in any capacity whatsoever. It is solely intended to help readers discover intriguing theories about markets that they may or may not want to explore on their own.
These are my own opinions and do not represent the opinions of my employer in any capacity whatsoever.